CanvasJS Charts
CanvasJS Charts : Reviews, Pricing, Features & AlternativesCanvasJS Charts is a Data Visualization Software. Price : $399 (free trial available). Review CanvasJS Charts : Overview & Pricing
CanvasJS Charts Overview : Features, Pricing, Reviews & Alternatives
CanvasJS Charts is a Data Visualization Software intended for businesses. Let’s discover user reviews, features and prices of this business app.
CanvasJS Charts is listed as a Data Visualization Software and Analytics Software for companies and is used for Data Visualization …
CanvasJS Charts price starts from $ 399 per user and per month (free trial available).
HTML5 JavaScript charts for data visualization
What is CanvasJS Charts ?
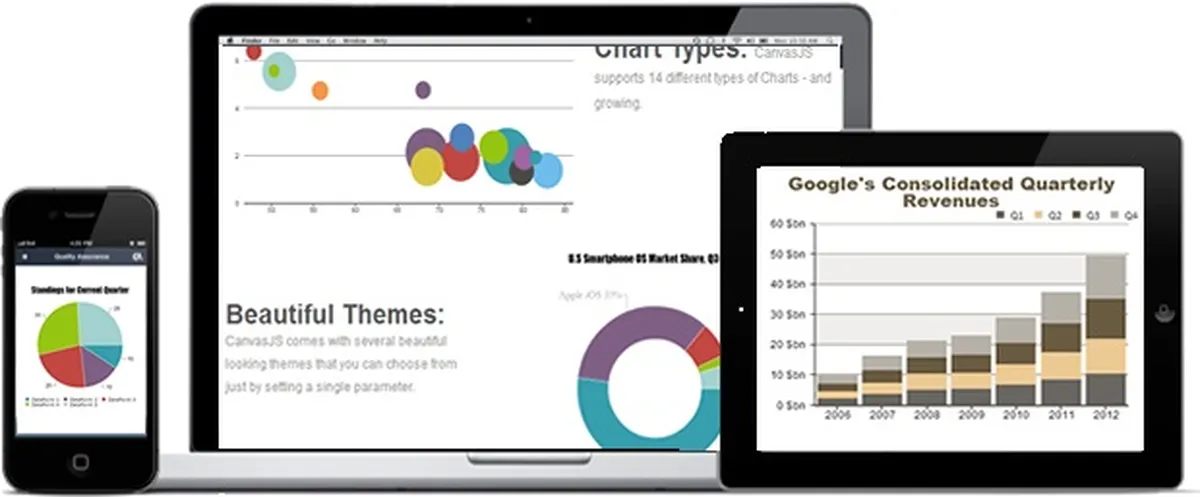
CanvasJS is an easy-to-use HTML5 and Javascript graphics library. It works on all devices including iPhone, iPad, Android, Windows Phone, Microsoft Surface, desktops, etc. This allows you to create rich dashboards that work across devices without compromising the maintainability or functionality of your web application. CanvasJS is about 10 times faster than conventional Flash and SVG graphics.
CanvasJS Charts Review : Pros & Cons
Pros & Cons
When it comes to finding the right Data Visualization tools to manage your business, you have too many options – and they all come with their strengths and weaknesses.
One such familiar name in this arena is CanvasJS Charts, and as you may have guessed from the title, this review will tell you more about CanvasJS Charts’s pros and cons.
Weighing the pros & cons is essential before selecting this tool for your business and your team.
CanvasJS Charts Pros : Key Benefits
– Use the simple API to connect with Javascript
– Choose from 30 chart types
– Benefit from improved performance
– Supports Chrome, Firefox, Safari, IE8+ and mobile devices
– Customize templates to create reports
CanvasJS Charts Cons
– Con : Not always the cheapest option : Data Visualization Software average cost is $ 157 .
– Con : Custom integrations can come at a price.
CanvasJS Charts Features
Here is the list of the main features of this computer software :
– API
– Activity Dashboard
– Charting
– Customizable Dashboard
– Customizable Reports
– Customizable Templates
– Data Visualization
– Performance Metrics
– Relational Display
– Reporting & Statistics
– Reporting/Analytics
– Search/Filter
– Simulation
– Visual Discovery
Main function & Pro Features
– Cloud Services
CanvasJS Charts Integrations
CanvasJS Charts integrates with more than 1 applications & plugins like Blissfully (…) : database connection, synchronize data, share files (…) to improve your workflow and increase your productivity !
It also provides a powerful API toolkit that allows developers to build web services and exchange data.
Top 20 CanvasJS Charts integrations
– Blissfully
CanvasJS Charts Pricing
The CanvasJS Charts pricing plan starts from $ 399 per month and per user, but this price is likely to change because different options are offered by the developer : number of licenses, additional functions, add-ons, bundles …
CanvasJS Charts offers several pricing plans :
– Free Trial : $ 399,00 per user / per month
– Start : –
– Professional : –
– Enterprise : –
– Premium : –
| Free Trial | Start | Professional | Enterprise | Premium |
| $399,00 | – | – | – | – |
| Per year | Per year | Per year | Per year | Per year |
| Per user | Per user | Per user | Per user | Per user |
Save $$$ on SaaS and on-premise Software Subscriptions to help your create, grow and scale your business : annual billing usually is cheaper than monthly billing and you can expect 10% to 20% discount.
Sign up for a trial and start using it right away !
Free trials usually are time limited or feature limited but this is a good way to ensure it is the right option for your business before making a purchase.
Screenshot of the Vendor Pricing Page :

Software Pricing Plans
Pricing Details
Pricing Model : Subscription
Free trial : Available
Free plan : No information
Freemium : No information
Starting price : $ 399,00
Entry-level set up fee : No setup fee
The pricing details were last updated this year from the vendor website or retrieved from publicly accessible pricing materials and may be different from actual. Please confirm pricing and deals with the vendor website before purchasing.
Deployment & Setup
CanvasJS Charts is a cloud-based Data Visualization platform : its infrastructure is hosted in the United States (probably on AWS, Microsoft Azure or Google Cloud Platform).
canvasjs-charts is a SaaS (Software as a Service) / web application : a web browser on a computer is required for full functionality of features and manage dashboard.
It supports desktop operating systems (like Windows …) and mobile platforms (like Android and iOS).
Technical Details & Specifications
Deployment : Cloud / SaaS
Desktop Operating Systems : Windows …
Mobile Platforms : Android / iOS – iPhone – iPad
Native Apps / Mobile Applications : –
GDPR compliance : No information
Supported languages
This application software supports the following languages : English …
Support & Training
Any problem with this computer program ? The vendor offers the following customer service & support to help teams get the most out of their business application : Chat, Email / Help Desk, Phone Support …
Hotline : Yes
Training options : Documentation …
Industry & Customers
Who use CanvasJS Charts ?
This software package is tailored to business needs : Public Administration, Non Profit, Entrepreneur …
This web-based application is recommended for trades : Professional …
This cloud software is used in the sectors : Services …
Customer References
Testimonials & Customer References to decide if this is the right business software or service for your company : No reference …
Awards & Recognitions
No information .
Screenshots
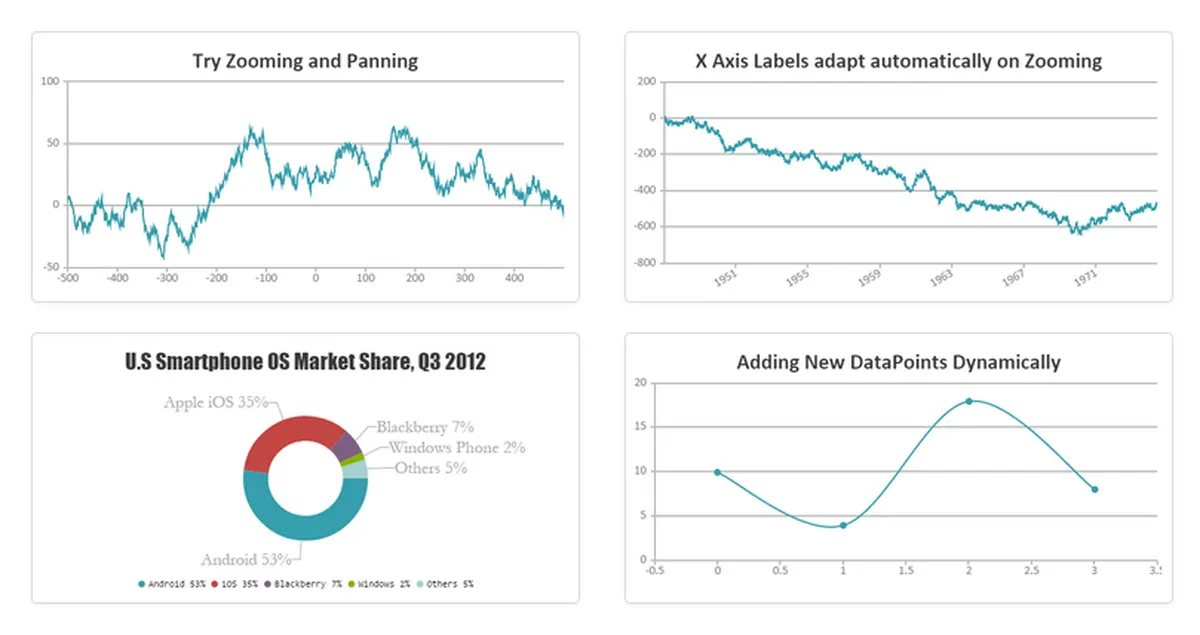
This computer program has an ergonomic, intuitive and customizable user interface, which will improve team productivity and collaborative work within your company (Shop Manager, Small Company, SME …)
CanvasJS Charts Screenshots & Images : UI, dashboard …

CanvasJS Charts Business Software Pricing
CanvasJS Charts Features & Overview
CanvasJS Charts Screenshot
Videos
This video is no longer available
CanvasJS Charts Reviews
Here is our opinion on CanvasJS Charts : this is a great data visualization software to recommend .
CanvasJS Charts User Reviews & Ratings
Online and customer reviews of CanvasJS Charts software are quite plentiful and overall very positive :
Overall rating : 4,8/5
Value for money : 4,2/5
Functionality : 4,4/5
Usefulness : 4,2/5
Ease of use : 4,2/5
User rating Excellent : 10%
User rating Very Good : 90%
User rating Average : 0%
User rating Poor : 0%
User rating Terrible : 0%
Popularity on social networks : 2151 fans on Facebook
Your Customer Review on CanvasJS Charts
What is your opinion about this app ? Submit your review and tell us about your overall opinion : experience with this SaaS software, rating, ease of use, customer service, value for money, Pros & Cons …
Customer reviews and feedbacks play an increasingly important role in the business software buying process. You can provide in-depth review and share your buying advice / reviewer sentiment : what is your likelihood to recommend CanvasJS Charts ? What is your likelihood to renew ?
FAQs
Why use a Data Visualization Software ?
Data visualization software processes information from an organization’s databases and presents it graphically. These visualizations range from simple charts and graphs to complex flowcharts and geographic maps. Many of these visualizations are interactive, allowing users to adjust certain parameters and see the impact in real time. Data visualization software uses big data to visualize data.
Main functions are : Basic visualizations, Interactive capabilities, Data / event alerts, Data visualization sharing, Import / Export, Formatting capabilities
Main characteristics are : Software is available over the Internet, application is maintained by the vendor, license to the software may be subscription based or usage based.
Data Visualization Software Average Price : from $ 12,00 to $ 499,00 with an average price of $ 157,00 .
Data Visualization Software Review
Company details
Developed by CANVASJS CHARTS, Inc.
HQ location : USA
Founded :
Total revenue :
Industry : B2B SaaS company
Software Category : Business Intelligence & Analytics Software > Analytics Software > Data Visualization Software
Schema : SoftwareApplication > BusinessApplication
Tags : javascript charts | canvas | JavaScript Libraries | charting library | Html5 | charting …
Website :
About This Article
This page was composed and published by SaaS-Alternatives.
The information (and product details) outlined above is provided for informational purposes only. Please Check the vendor’s website for more detailed information.
Our opinion on CanvasJS Charts is independent in order to highlight the strengths and weaknesses of this Data Visualization Software. Our website is supported by our users. We sometimes earn affiliate commission when you click through the affiliate links on our website.
CanvasJS Charts Alternatives
If you’re understanding the drawbacks and you’re looking for a CanvasJS Charts alternative, there are more than 5 competitors listed on SaaS-Alternatives !
If you’re in the market for a new software solution, the best approach is to narrow down your selection and then begin a free trial or request a demo.
Top 10 Alternatives & Competitors to CanvasJS Charts
– Style Scope
– Zoho Analytics
– Klipfolio
– Yellowfin
– Tableau
You can also take a look at other business apps, like our LeanLaw review and our Upscope review.
Comparison with Similar Software & Contenders
Take an in-depth look at popular Business Intelligence & Analytics Software and Analytics Software to find out which one is right for your needs. Discover how these Data Visualization Software compare to CanvasJS Charts when it comes to features, ease of use, customer support and user reviews. Explore software, Compare options and alternatives, Read reviews and Find your solution !

